Project Overview
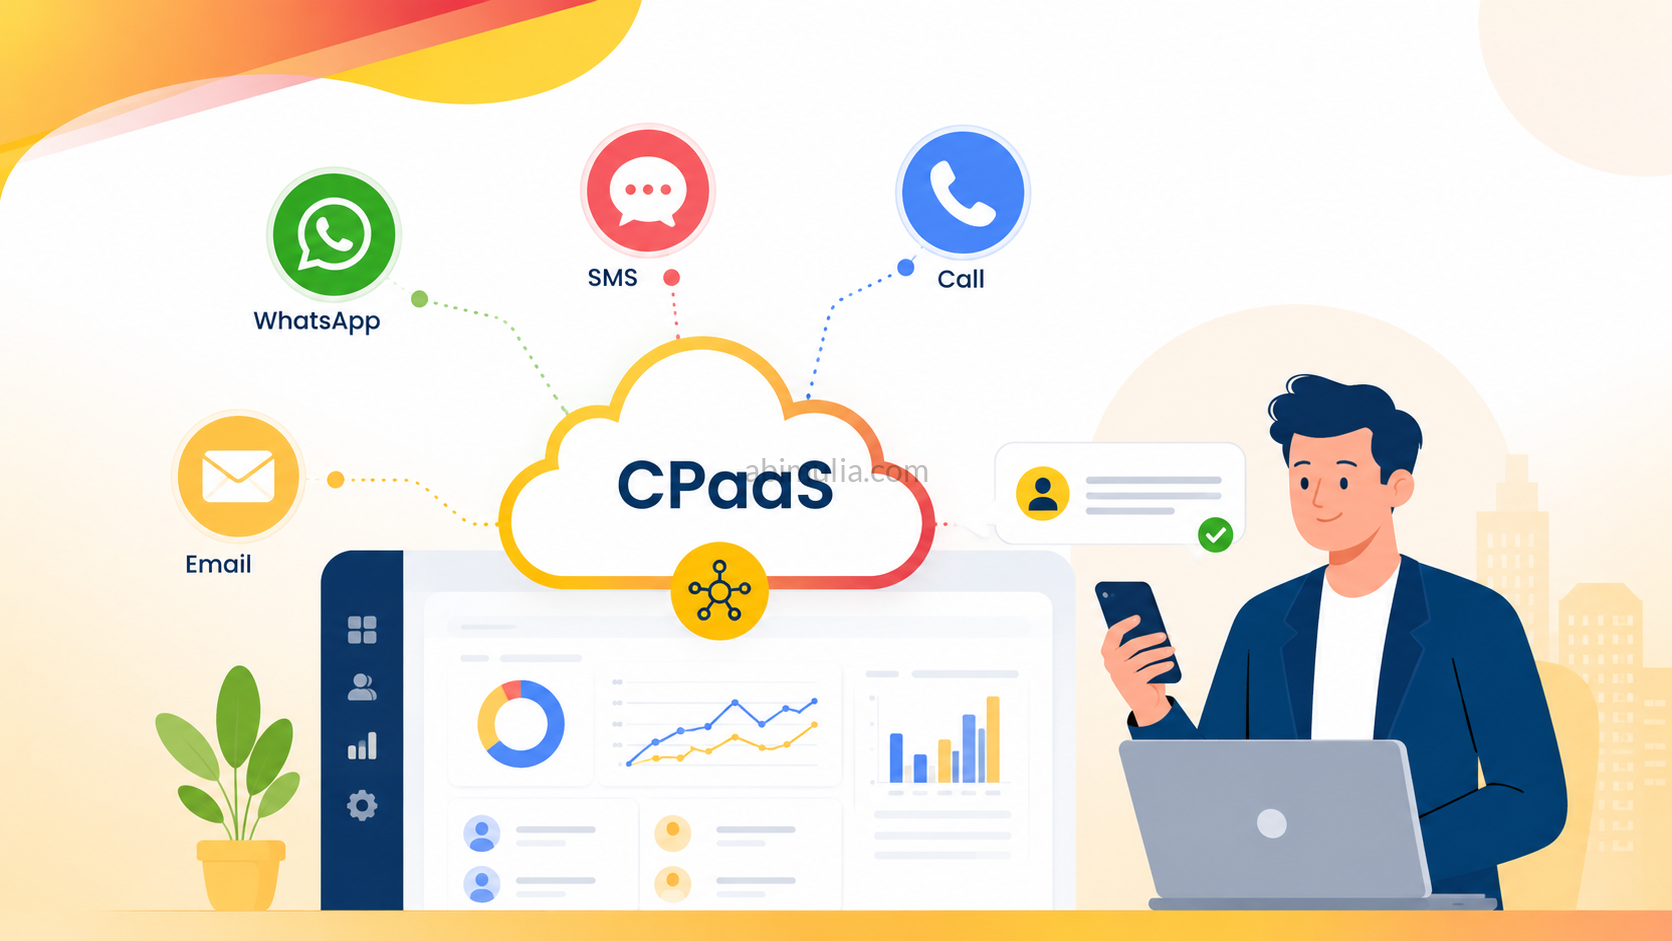
- Company: OCA Indonesia (Communication Platform-as-a-Service under Telkom Indonesia)
- Timeline: January 1, 2025 – March 31, 2025
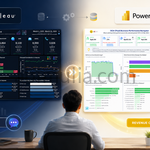
- Tools Used: Google BigQuery, Google Sheets, Tableau Public
The Challenge (Problem Statement)
- Data Pipeline & Cleaning: Processed message transactions and delivery logs in Google BigQuery. Handled missing values, standardized delivery states (
Success,Failed,Read,Delivered), and normalized timestamps. - Advanced Modeling & Logic: Established current vs. previous period comparison logic using time-intelligence metrics. Calculated custom metrics such as Average Revenue per User (ARPU) and platform traffic growth via FIXED LOD Expressions in Tableau.
- UI/UX Optimization: Designed a professional dark-themed enterprise layout featuring visual hierarchy, collapsible filter panels, responsive KPI cards, and dynamic executive insight blocks.
Dashboard Architecture
The interactive architecture was divided into 3 specialized reporting layers:
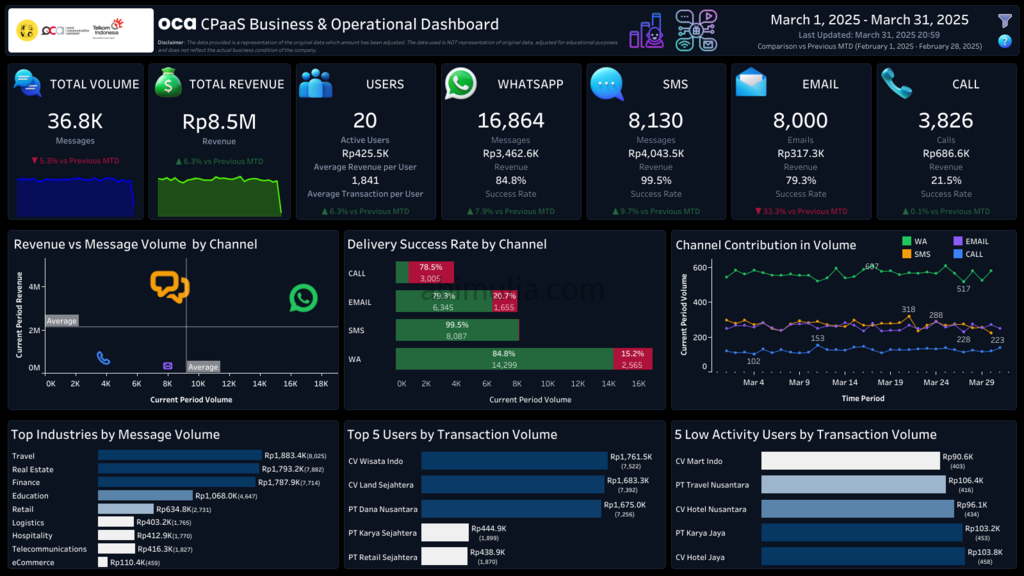
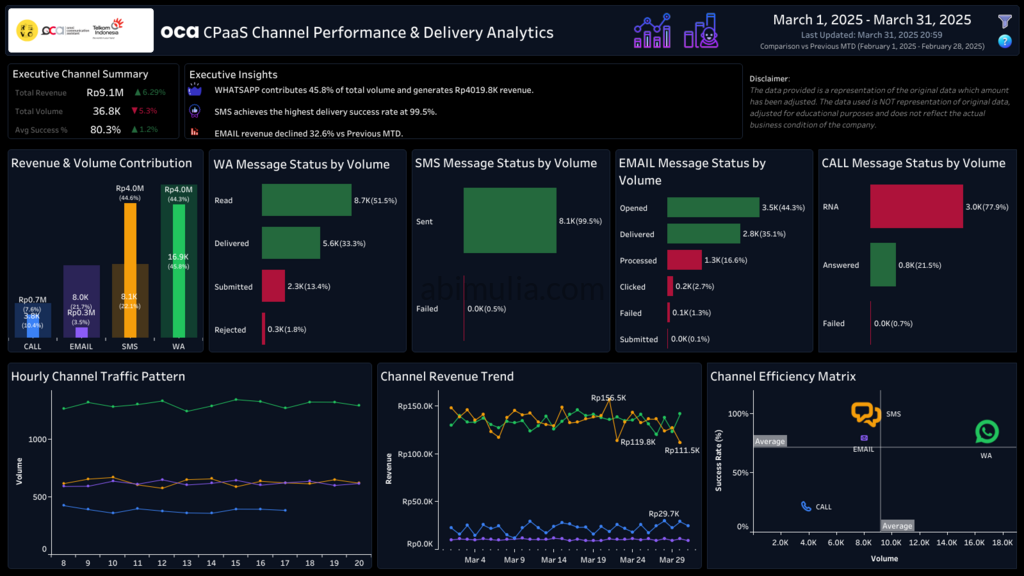
- Executive Dashboard: High-level overview of overall metrics (36.8K Messages, Rp8.5M Revenue, 20 Active Users, and Rp425.5K ARPU).
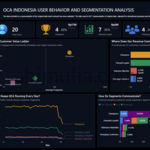
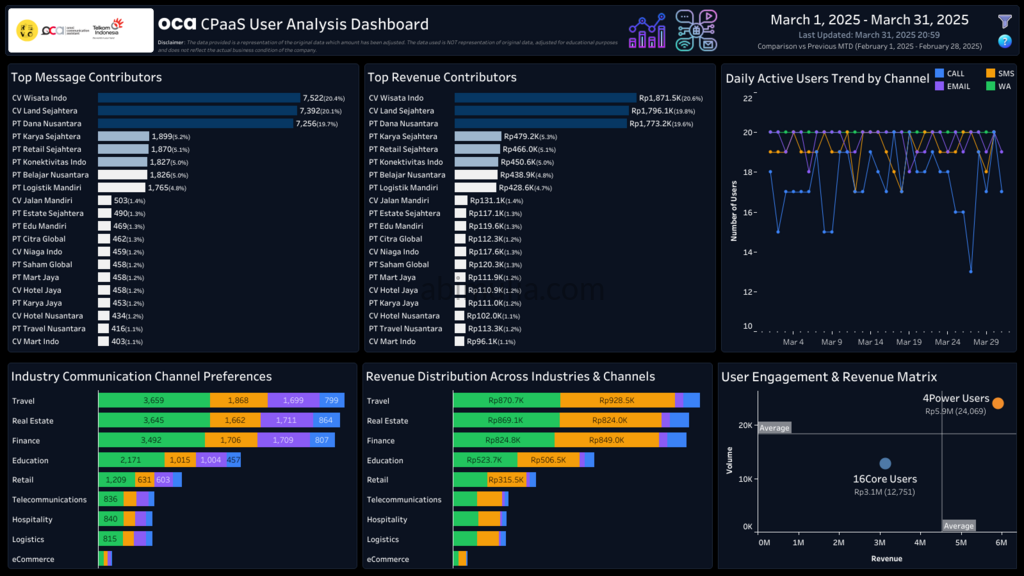
- User Analysis Dashboard: Focused on customer behavioral tiers, industry preferences, and value distribution matrix.
- Channel Analysis Dashboard: Evaluated operational reliability, delivery success benchmarks, and hourly traffic waves.
Click to here to see Live Tableau Dashboard
Strategic Insights & Actionable Recommendations
The 80/20 Rule Confirmed: 20% of active accounts (“Power Users”) generate 62% of revenue. Recommendation: Implement a VIP loyalty framework and proactive Key Account Management (KAM) workflows to secure core margins.
Channel Performance Inversion: WhatsApp dominates volume traffic (45% contribution), and SMS holds an outstanding 99.5% delivery success rate. Conversely, Email revenue tumbled by 32.6%, and Voice Call showed severe operational failure with only a 23.5% success rate. Recommendation: Double down on industry-specific WhatsApp templates, pitch SMS for secure notifications (OTP), and conduct technical audits on operator routes for Calls.
Traffic Wave Management: The Travel industry dominates 31% of platform traffic, and system loads predictably spike during 09:00–11:00 and 14:00–16:00. Recommendation: Implement infrastructure auto-scaling during those peak windows to maintain system stability and optimize server costs.