Project Summary
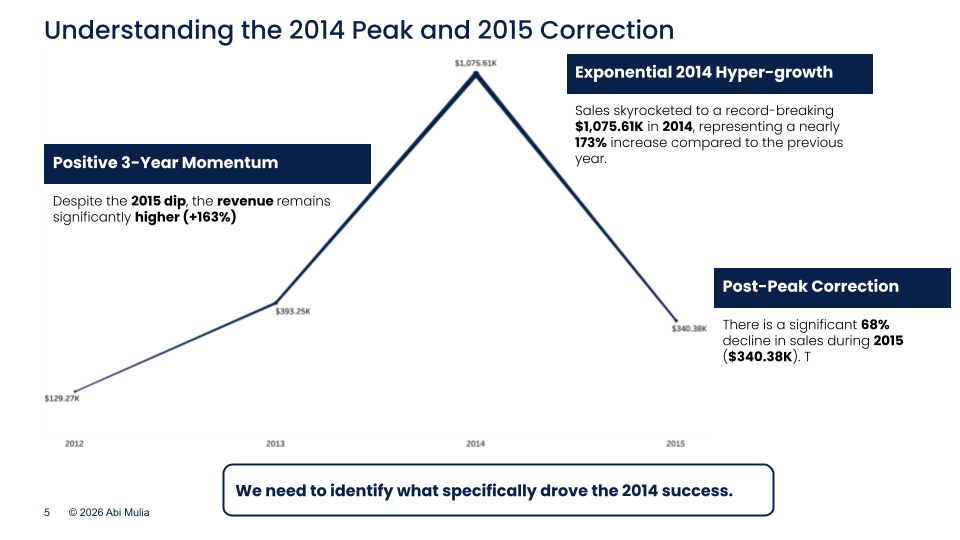
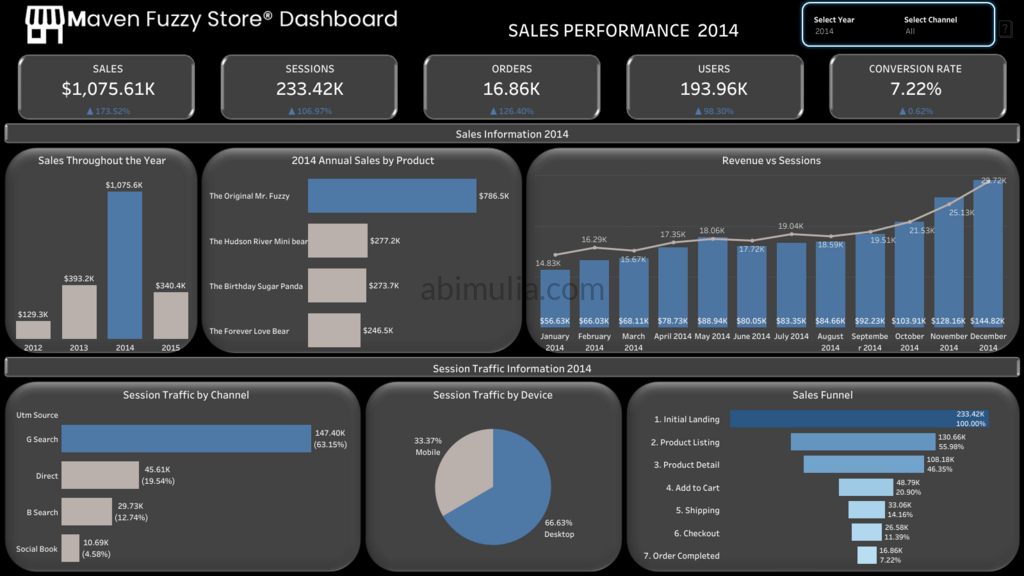
Maven Fuzzy Factory is a D2C e-commerce retailer selling teddy bears that launched in 2012. After achieving a historic revenue peak of $1,075.61K in 2014, the business faced a sudden 45% revenue decline in early 2015. This project analyzes marketing performance and website funnels to identify root causes and restore growth momentum.
Goals
The primary objective was to identify the causes of the $144.82K (Dec 2014) to $78.95K (March 2015) revenue drop. The project aimed to increase the session-to-order conversion rate to ≥10% and improve revenue per session by ≥8%. Additionally, it sought to reduce critical funnel drop-offs by ≥15% through data-driven optimizations.
Tools
Python, Tableau
Methodology
Exploratory Data Analysis (EDA), Funnel Analysis
Process
The analysis followed a structured methodology: data preparation and cleaning using Python, followed by Exploratory Data Analysis (EDA) to evaluate channel attribution and trend patterns. Website funnel analysis was conducted to pinpoint friction in the customer journey. Finally, results were visualized in a Tableau dashboard to communicate actionable insights and strategic recommendations.
Output
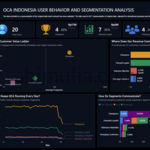
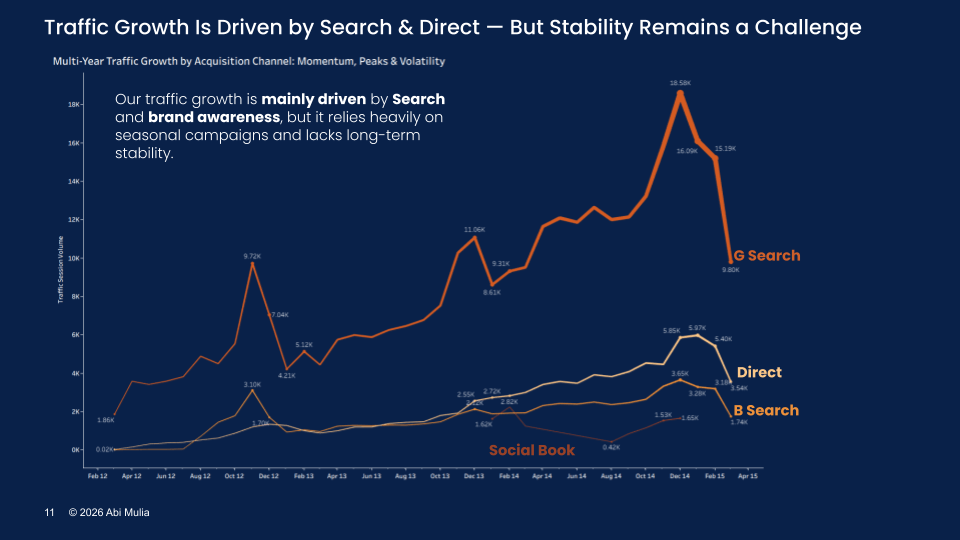
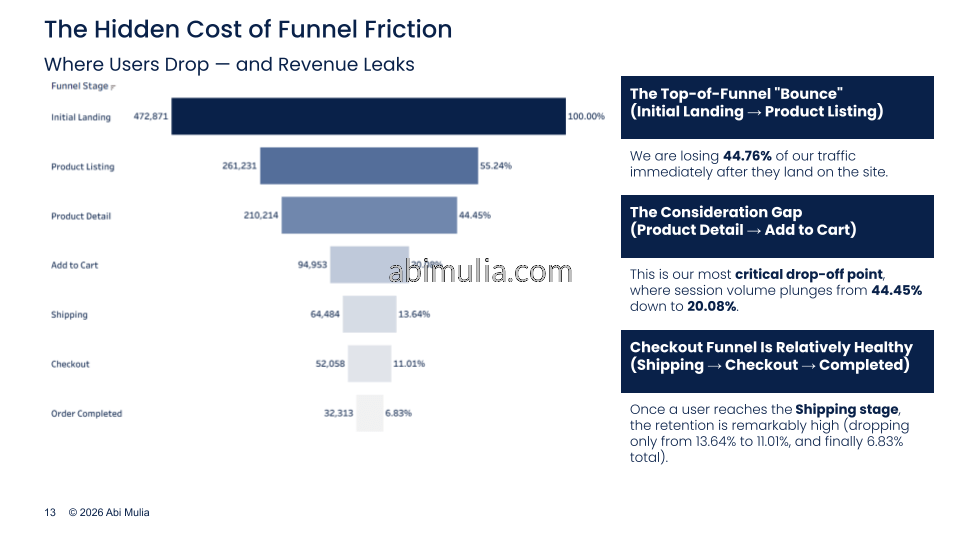
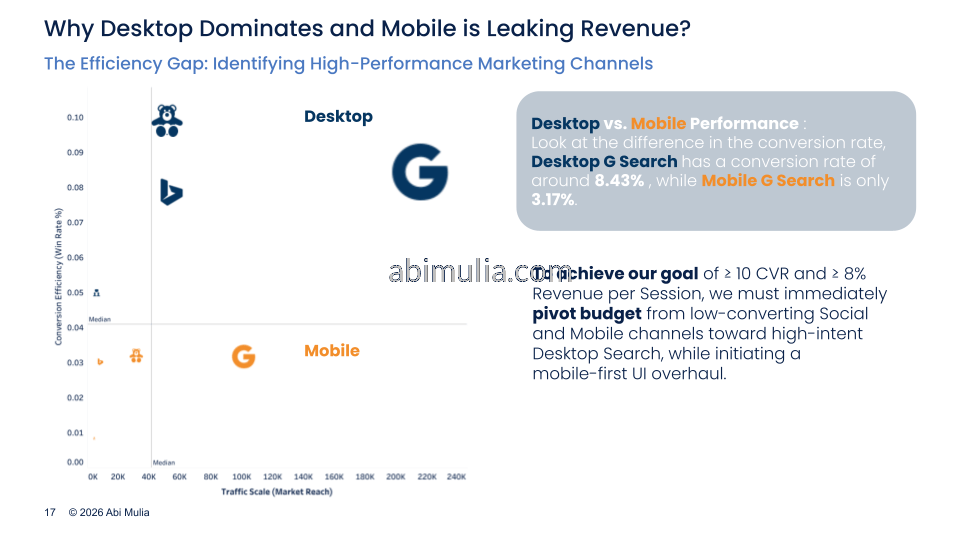
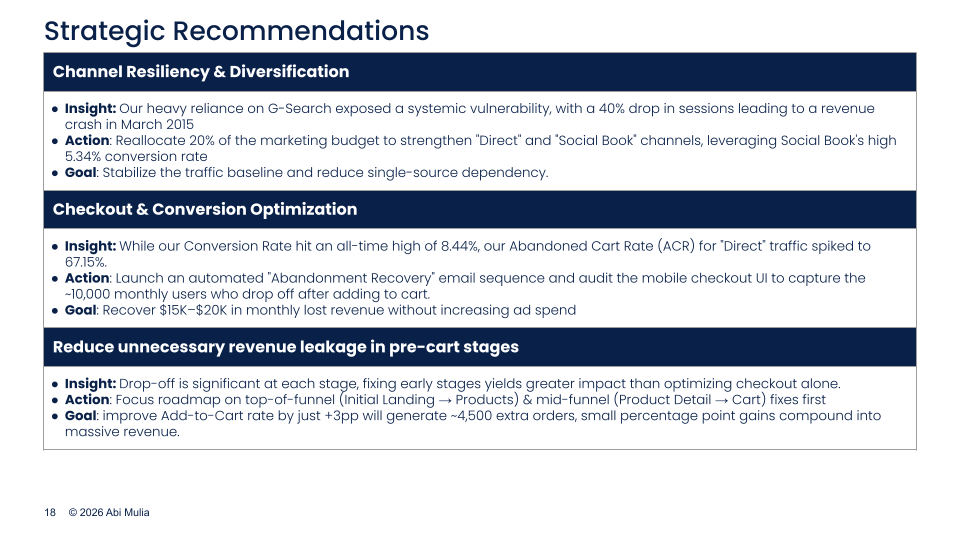
Analysis revealed a 44.76% bounce rate at landing and a critical 54.82% drop-off at the product-to-cart stage. Recommendations include reallocating 20% of the budget to Direct and Social Book channels to reduce G-Search dependency and launching automated recovery emails to capture lost revenue. A mobile-first UI overhaul is required as desktop conversion significantly outperformed mobile.
Scope of Work / Achievements
- Analyzed marketing channels and website funnels to identify the root causes of a 45% revenue decline in 2015.
- Identified critical friction points where 44.76% of traffic bounced at landing and 54.82% dropped off before adding products.
- Recommended reallocating 20% of marketing spend to high-converting channels like Social Book to stabilize the volatile traffic baseline.
- Developed a dashboard to visualize KPIs using Tableau, uncovering a 5.26 percentage point conversion gap between desktop and mobile users.
Click here to see Full Deck and Tableau Dashboard