The Big Picture
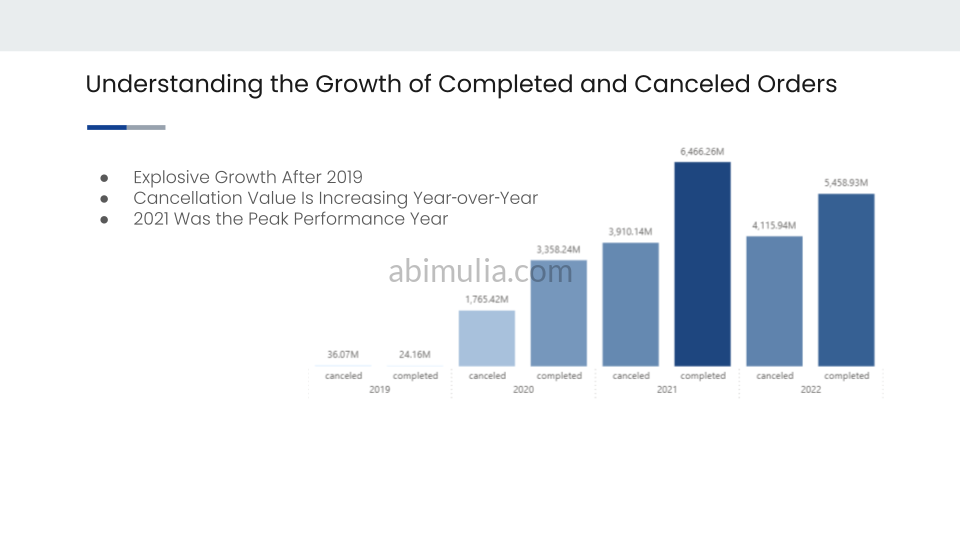
EcommerceU is a growing platform, but in 2022, they hit a snag: revenue dropped by about 16% compared to the previous year. The weird part? The number of customers and sessions stayed pretty stable. This meant the problem wasn’t getting people to the site—it was getting them to actually finish their checkout without canceling.
The Goals
The mission was to find out exactly where customers were getting stuck and boost the “transaction completion rate” by 5%. Success here meant potentially recovering 278 million in lost revenue—basically fixing nearly 28% of the previous year’s dip.
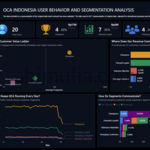
The Game Plan
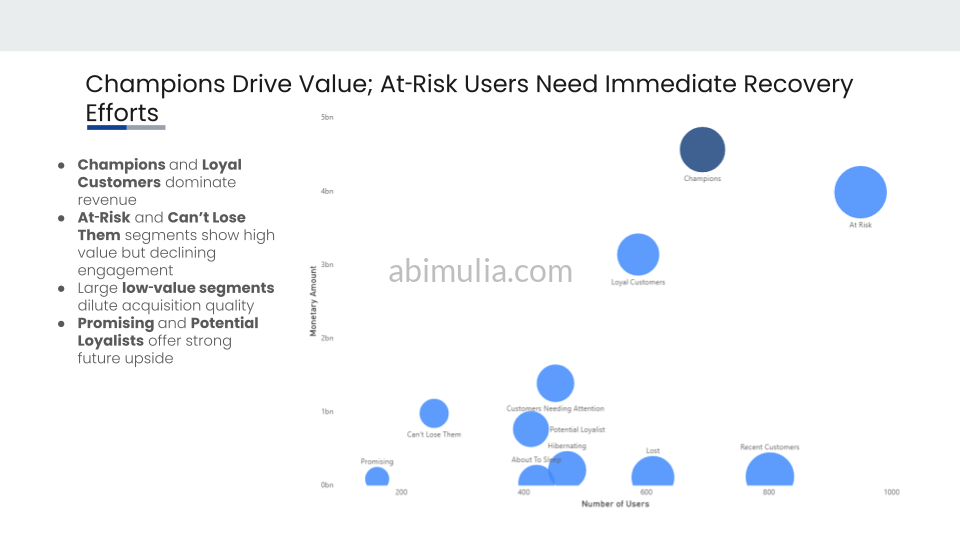
I dug into the data using SQL and BigQuery to track the “customer journey“. I looked at everything from how people browse to how they pay. I also grouped customers using a method called RFM analysis to see who our most loyal fans are and who we are at risk of losing.
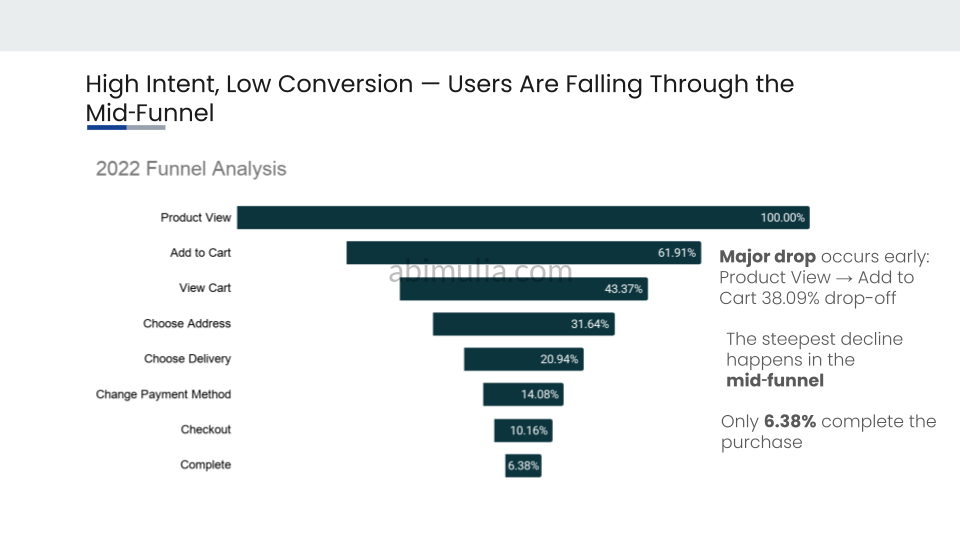
The Result
I discovered a massive “leak” in our sales funnel: over 38% of users drop off right after looking at a product before they even add it to their cart. By the end of the journey, only about 6.38% of people actually buy something. To fix this, I proposed simplifying the checkout process, being more transparent about shipping costs early on, and fixing payment errors.
KEY ACHIEVEMENTS
- Analyzed a 16% year-over-year revenue drop using BigQuery to pinpoint why sales were stalling despite steady traffic.
- Identified a major “leaky bucket” in the sales funnel where 38% of potential buyers leave before adding items to their cart.
- Mapped customer loyalty levels (RFM) to help the team focus on “At-Risk” high-value spenders who were starting to slip away.
- Proposed data-backed fixes for the checkout process that could potentially bring back 278 million in revenue.
Click here to see Full Deck, SQL BigQuery and Google Sheets